
Measure how well surgery time is used, who books what, and which treatments are being carried out.
Who it is for: practice managers and administrators, clinicians.
In this guide:
- Check each clinician’s scheduled and booked time
- Read the Clinician Usage dashboard
- See who booked appointments and when bookings were made
- Find out which treatments were carried out
1. Check each clinician’s scheduled and booked time
You can use the first Clinician Usage item (the Clinician Time Usage table) to compare scheduled time with appointment and event time, and download it.
Why this matters Surgery time is the practice’s main asset. Utilisation tells you how much of each clinician’s scheduled time was actually filled with appointments. NHS practices also use it to check they are on track to deliver their contracted UDAs or UOAs – empty chair time early in the year is hard to recover later. Private practices use it to see whether a new hygienist day is paying for itself.
Where to find it Reports › Utilisation. There are two menu items called Clinician Usage. This step is the first one; it opens a table headed Clinician Time Usage.
How to
- Click the first Clinician Usage. It opens on the current week (weeks start on a Monday).
- Move with Back a week and Forward a week, or pick a Monday in the calendar.
- Choose a Clinician in the panel header, or leave it on All.
- Read one row per clinician per day: Clinician, Date, Scheduled Time (from their diary schedule), Lunch, Appointment Time, No. Appointments, Event Time and No. Events (blocked time such as meetings or training).
- Click Download week Excel File to save the figures for your own spreadsheet.
- Save & Exit closes the tab.
Good to know
- Scheduled Time comes from Housekeeping › Diary Schedules. If it looks wrong, the schedule is wrong, not the report.
- Lots of Event Time can hide under-booking – ask what the events were.
- Clinicians may find their own row useful for planning, but treat comparisons between colleagues with care: different specialisms book very differently.
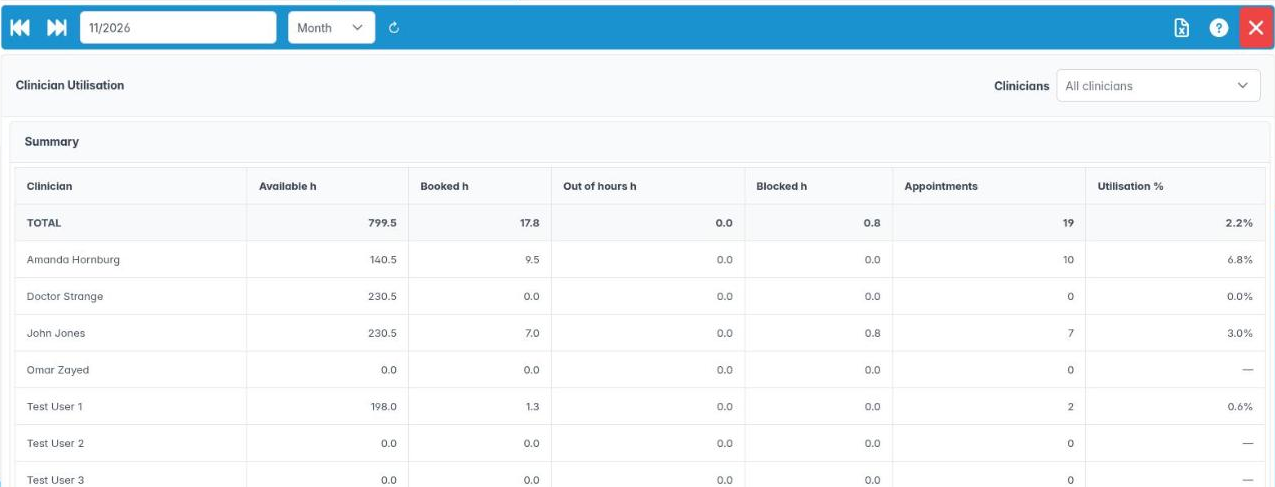
2. Read the Clinician Usage dashboard
You can use the second Clinician Usage item to read utilisation percentages, charts and available time for each clinician.
Why this matters The table in the first Clinician Usage item gives you raw times. The second Clinician Usage item turns the same figures into a dashboard: totals, a utilisation percentage, colour-coded cards and charts. It is the quicker way to answer “who has spare capacity next week?” or “which day is quiet?” when you are deciding where to book a new patient or whether to add a session.
Where to find it Reports › Utilisation, the second item called Clinician Usage. The panel is headed Clinician Usage Dashboard.
How to
- Click the second Clinician Usage. It opens on the current week.
- Move with Back a period and Forward a period, or pick a Monday.
- Choose a Clinician, or leave it on All.
- Key Metrics shows Total Appointments, Total Events, Active Clinicians, Avg. Appointments/Day and Avg. Utilization.
- Clinician Availability & Utilization shows a card per clinician with a percentage badge – green at 80% or more, amber from 60%, red below – plus Scheduled Time, Appointment Time, Event Time, Lunch Time and Available Time. Available time in red means they are overbooked.
- Below are charts of time usage and appointments by clinician (or by day, when you choose one clinician), a Daily Trend chart and a Detailed Data Table.
Good to know
- Utilisation here is appointment time plus event time, divided by scheduled time.
- This dashboard has no download button. Use the first Clinician Usage item when you need a spreadsheet.
3. See who booked appointments and when bookings were made
You can tell the difference between Bookings Made By and Bookings Made On and use both to review reception workload.
Why this matters These two dashboards are about the people who book, not the clinicians. They help a practice manager see how booking work is shared across the front desk, whether online booking is taking load off reception, and which appointment types each person books.
Where to find it Reports › Utilisation › Bookings Made By (panel Appointments Booked By Dashboard) and Reports › Utilisation › Bookings Made On (panel Appointments Booked On Dashboard).
How to
- Open either report. It shows one week; use Back a week, Forward a week or pick a Monday. Refresh Data reloads the figures.
- Choose a person in Booker.
- Read Key Metrics: Booker’s Total (Week), All Bookers (Week), % of Total, Appointment Types and Week Starting.
- The chart Appointments by Type and Day shows that booker’s appointments for each day, split by type. The Detailed Data Table lists Appointment Type, Count and % of Total, with a totals row.
The difference
- Bookings Made By counts appointments that take place in the chosen week, grouped by who booked them. Use it to ask “who filled next week’s diary?”
- Bookings Made On counts appointments that were booked during the chosen week, whenever they are for. Use it to measure booking workload – “how many bookings did Sam make on Monday?”
Good to know
- Only appointments that are still booked are counted; cancelled ones drop out.
- Open both with the same week to compare: a big gap usually means lots of bookings far into the future, such as six-month recalls.
4. Find out which treatments were carried out
You can use Treatment Codes and Treatment Summary to count treatment items by week or month, by clinician and by code.
Why this matters Knowing what was actually done matters for many jobs: checking how many scale and polishes a hygienist did, how many crowns went to the lab this month, whether a new whitening offer is being taken up, or what mix of NHS items is driving your UDA count. These two reports count charged treatment items.
Where to find it Reports › Utilisation › Treatment Codes and Reports › Utilisation › Treatment Summary. Both panels are headed Treatment Code Usage with the month.
How to
- Choose Weekly or Monthly in the interval list on the toolbar. Then move with Back a week/month and Forward a week/month, or pick a date.
- Treatment Summary gives one line per code: Qty, Total (value) and Treatment Code. Choose a Clinician to narrow it. This is the quick totals view.
- Treatment Codes lists the individual items. First pick a Favourites group (or All), then a Treatment Code, and optionally a Clinician. Columns are Qty, Total, Date of charge, Treatment Code, Clinician and Patient.
- In either report, right-click a row and choose Patient Details to open the patient.
- Click Download week Excel File (or month) to save the figures.
Good to know
- Favourites come from Housekeeping › Treatment Favourites, which keeps the code list manageable.
- Only charged items appear. Treatment still planned, not yet carried out, is not counted here.